
Sometimes, what is left out, shines brighter than anything else in a report
More than 9,000 anti-Asian incidents have been reported across the United States since the coronavirus pandemic began, according to a report released on Thursday.
Stop AAPI Hate, a national coalition that tracks and responds to racially motivated hate crimes towards Asian Americans and Pacific Islanders, received 9,081 reports between 19 March 2020 and this June. A total of 4,548 hate crimes occurred in 2020 and another 4,533 occurred in 2021.
Since the coronavirus was first reported in China, members of Asian American and Pacific Islander communities across the US have faced bigotry in the form of verbal harassment and physical attacks. Many blame Donald Trump for helping to stir anti-Asian sentiment by using racist terms when referring to the virus, such as “Chinese virus” and “kung flu”.
More than 9,000 anti-Asian incidents reported in US since pandemic started | Race | The Guardian
And that does it: Effing White Supremacists! Next, we have the shocking statistics:
According to the report, 63.7% of the incidents involved verbal harassment and 16.5% involved shunning – the deliberate avoidance of Asian Americans and Pacific Islanders. About 13.7% of the reports were of physical assault, the third-largest category of total reported incidents. Civil rights violations accounted for 11% of the incidents while online harassment made up 8.3%.
Incidents reported by women made up 63.3% of all reports.
The number of seniors – 60 years old and older – reporting hate crimes increased from 6.5% in 2020 to 7.2% in 2021. Since the pandemic began, the majority of the headline-making attacks have involved senior Asians across the country, with many being beaten, kicked, shoved or stabbed.
Sickening! Anything else? Well, there is the Stop AAPI Hate National Report – Stop AAPI Hate page but it does not deviate much. You can go straight to the official national report and you will find two interesting things, one of them a phenomenal “Oh shit! I was not expecting that!” and the other is a missing chunk of data, negative to the politics and narrative for obvious reasons. First, this cute graphic:
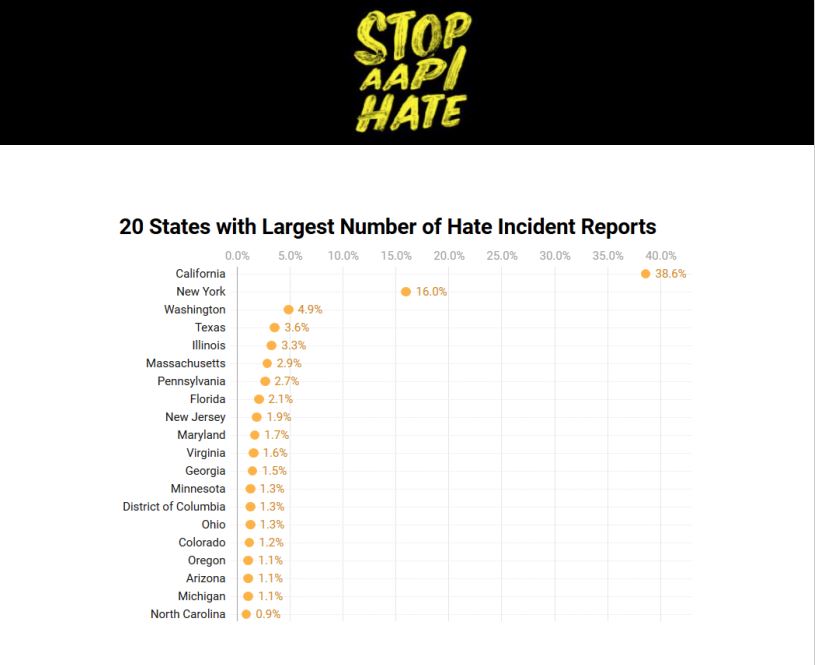
Almost 60% (59.5%) of the Hate Incidents against Asians in the United States come from some of the most Blue , Liberal and “We love all races!” states.

And about what is missing in the reports? The race of the attackers. OK, I know you knew this was obvious, but they could not attempt to go against the White Supremacists Narrative but they had to prop it up which is why they mentioned President Trump from the get-go. It would not look good if the stats indicate that other minorities are the main attackers of old Chinese ladies going to the market. Unfortunately, we have seen the videos of just that and how the media conveniently leaves out mentioning race unless the attacker has some white in him or can be tagged with a “White-” prefix in some way.
This is like identifying that malaria is a blood-borne transmittable disease that needs to be controlled, but not mentioning the mosquitoes because you don’t want to upset animal rights activists and PETA.
“More than 9,000 anti-Asian incidents have been reported across the United States since the coronavirus pandemic began, according to a report released on Thursday.”
And… how many anti-Asian incidents were there before the panicdemic?
Data, presented out of context, is a meaningless curiosity. The McDonald’s on 1st and Main sold 1,024 Big Macs during yesterday’s lunch rush tells me that they sold 1,024 Big Macs. Nothing more.
Also:
“Almost 60% (59.5%) of the Hate Incidents against Asians in the United States come from some of the most Blue , Liberal and “We love all races!” states.”
NY, CA, and WA are also the states with the highest number/percentage of Asians. I am kind of surprised to see TX listed as #4 on that list.
Final note. Given the type of incident reported, concurrent with the MSM screaming day and night that calling it the Chinese virus would result in hate crimes against Asians, I would say a lot of the people who reported “verbal harassment” had increased levels of sensitivity toward interpersonal communication. To put it bluntly, they were looking for a reason to report harassment, and anything less than a 100% cordial conversation fit the bill.
I thought about that one a little bit too. Texas has several large urban areas, more than many other states as well as a large overall population, and the percentages as reported looked to be raw, which means if those percentages were adjusted per capita, I would expect Texas to move down in the list and California, New York, and Washington State would look even worse.
…and 16.5% involved shunning – the deliberate avoidance of Asian Americans and Pacific Islanders.
How can you tell whether it is shunning or maintaining social distance?