What happens when you gather 80,000 Second Amendment Loving Americans into a small area for a weekend of gun-related fun? Blood in the streets? Indiscriminate shootings? Bodies piling up at the smallest of offense? You know the answer.
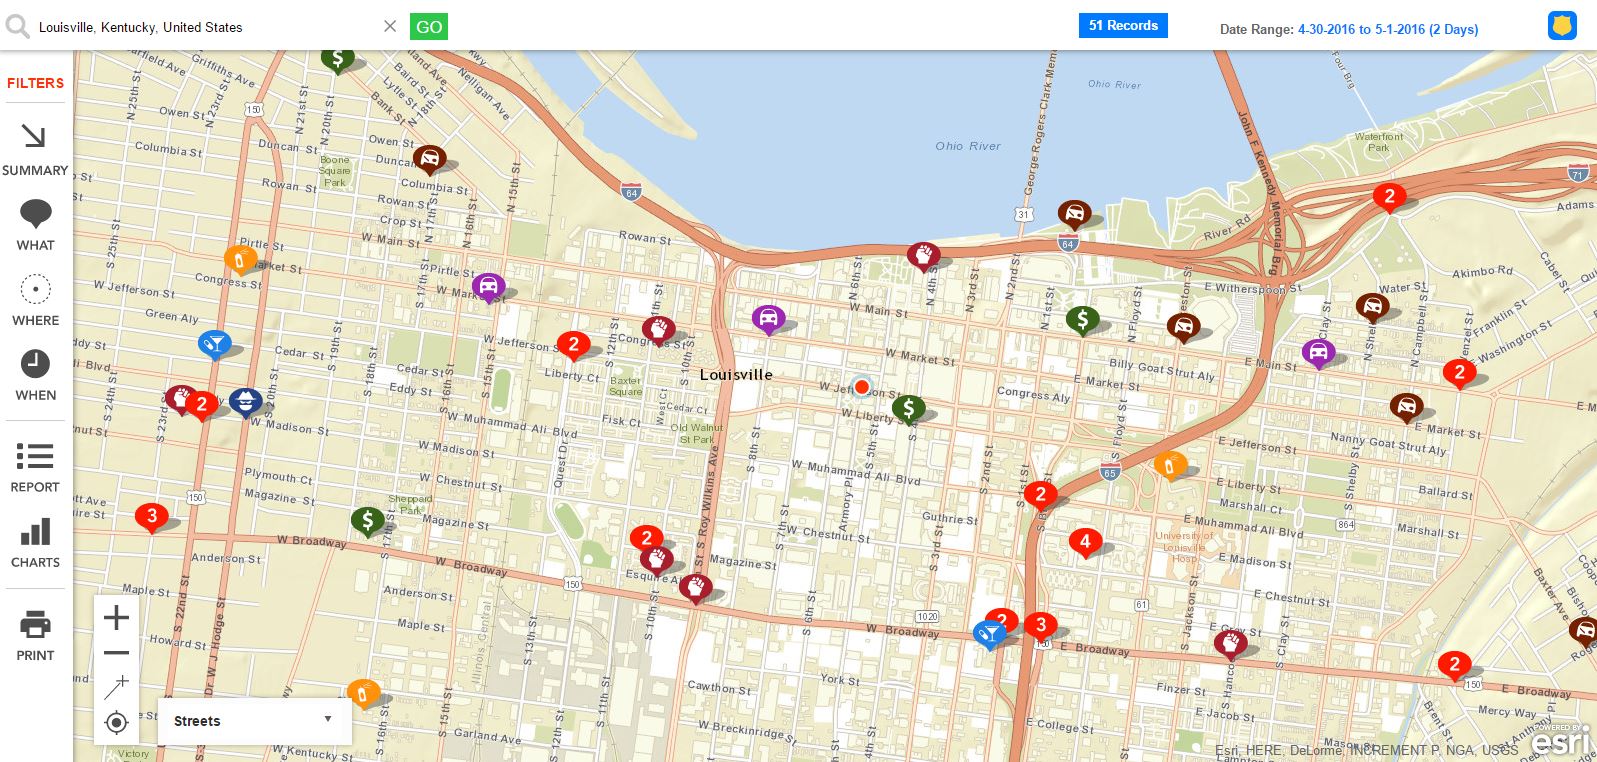
Same as last year, I checked with CrimeMapping.com and used them again this year to capture the results for your convenience. I checked the three previous weekends for comparison purposes.
Weekend of 4/30/2016 to 5/1/2016
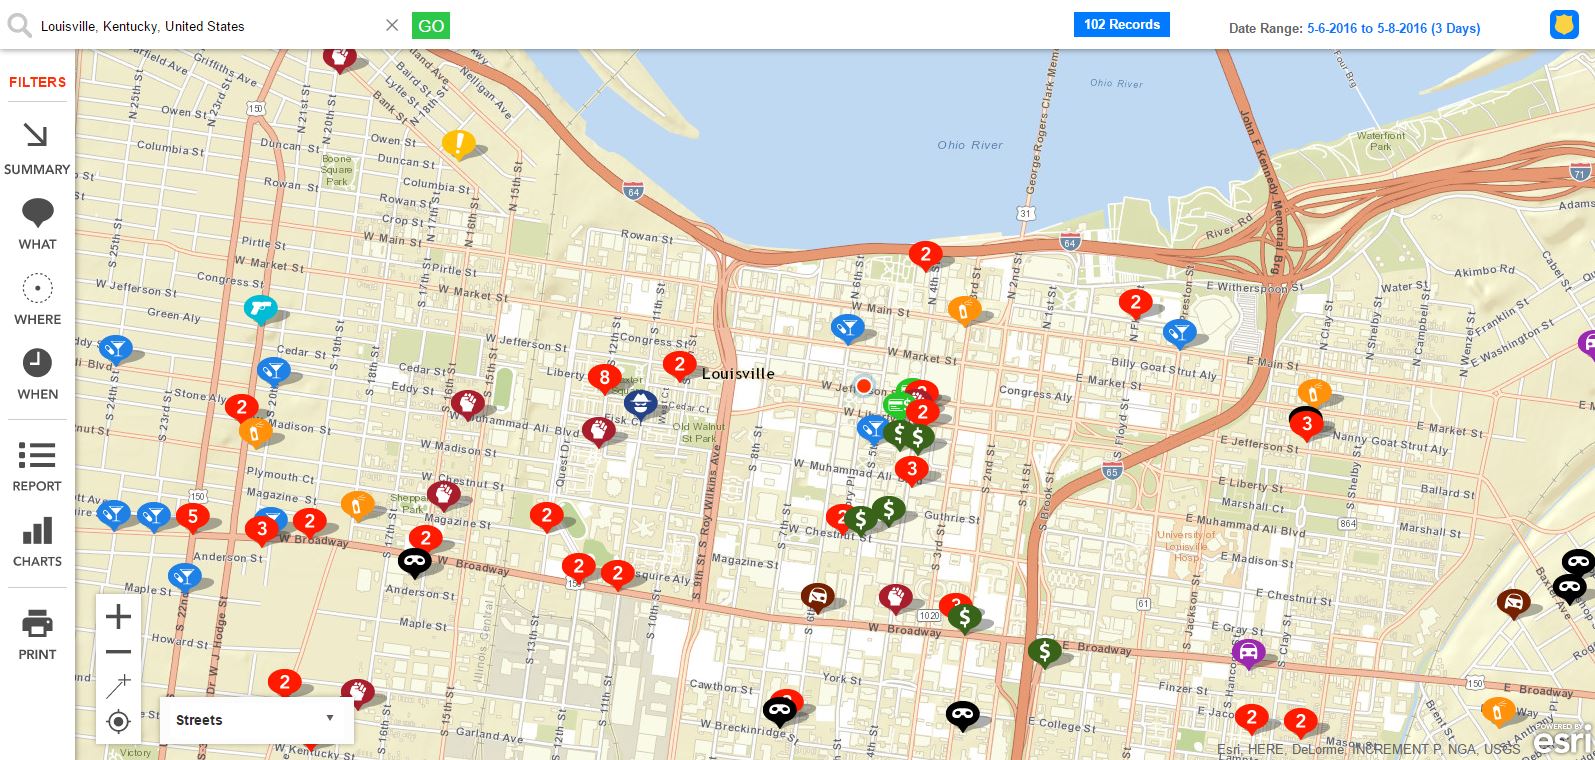
Next is the weekend of 5/6/2016 to 5/8/2016
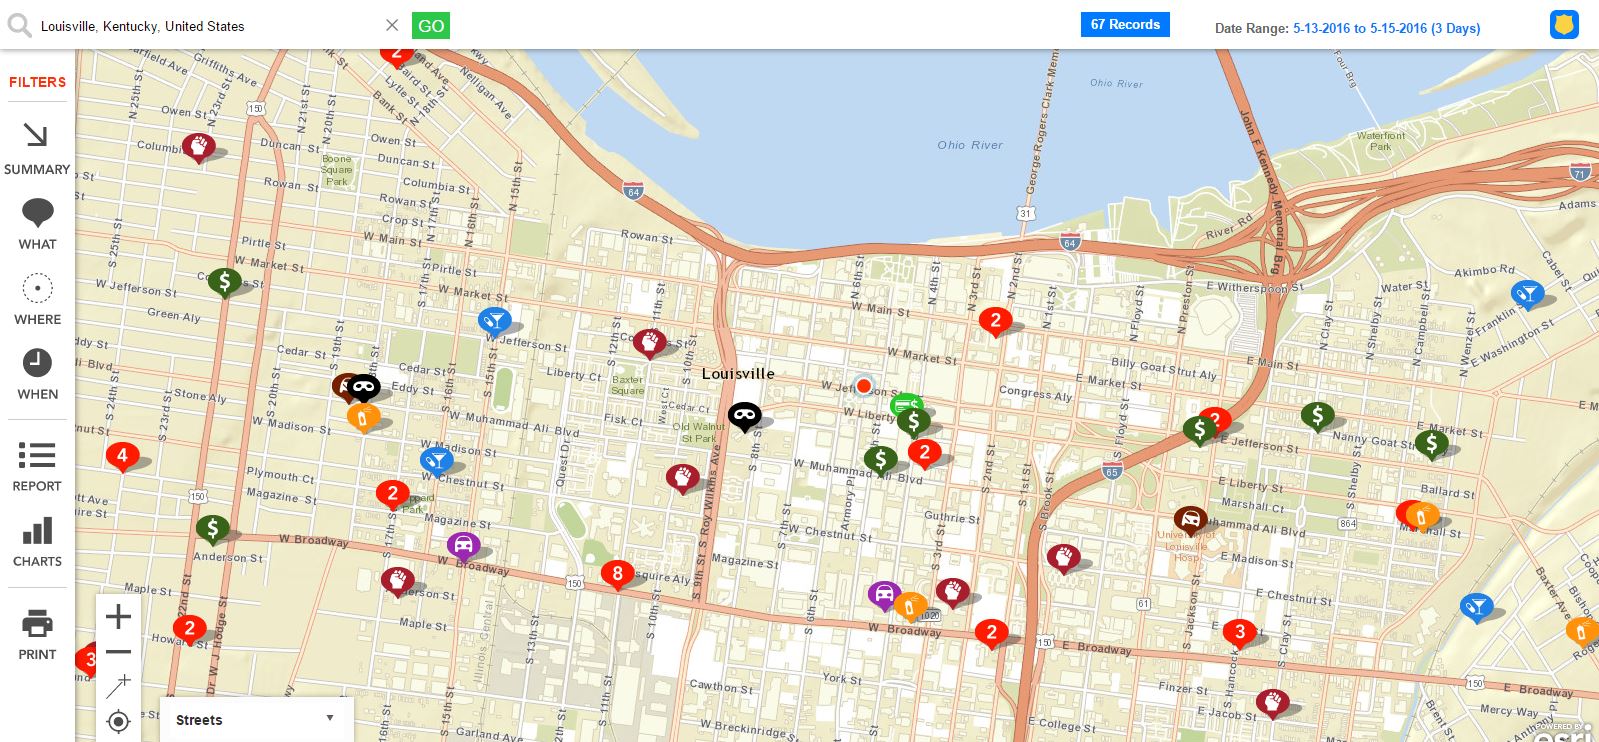
And then we have the weekend of 5/13/2016 to 5/15/2016
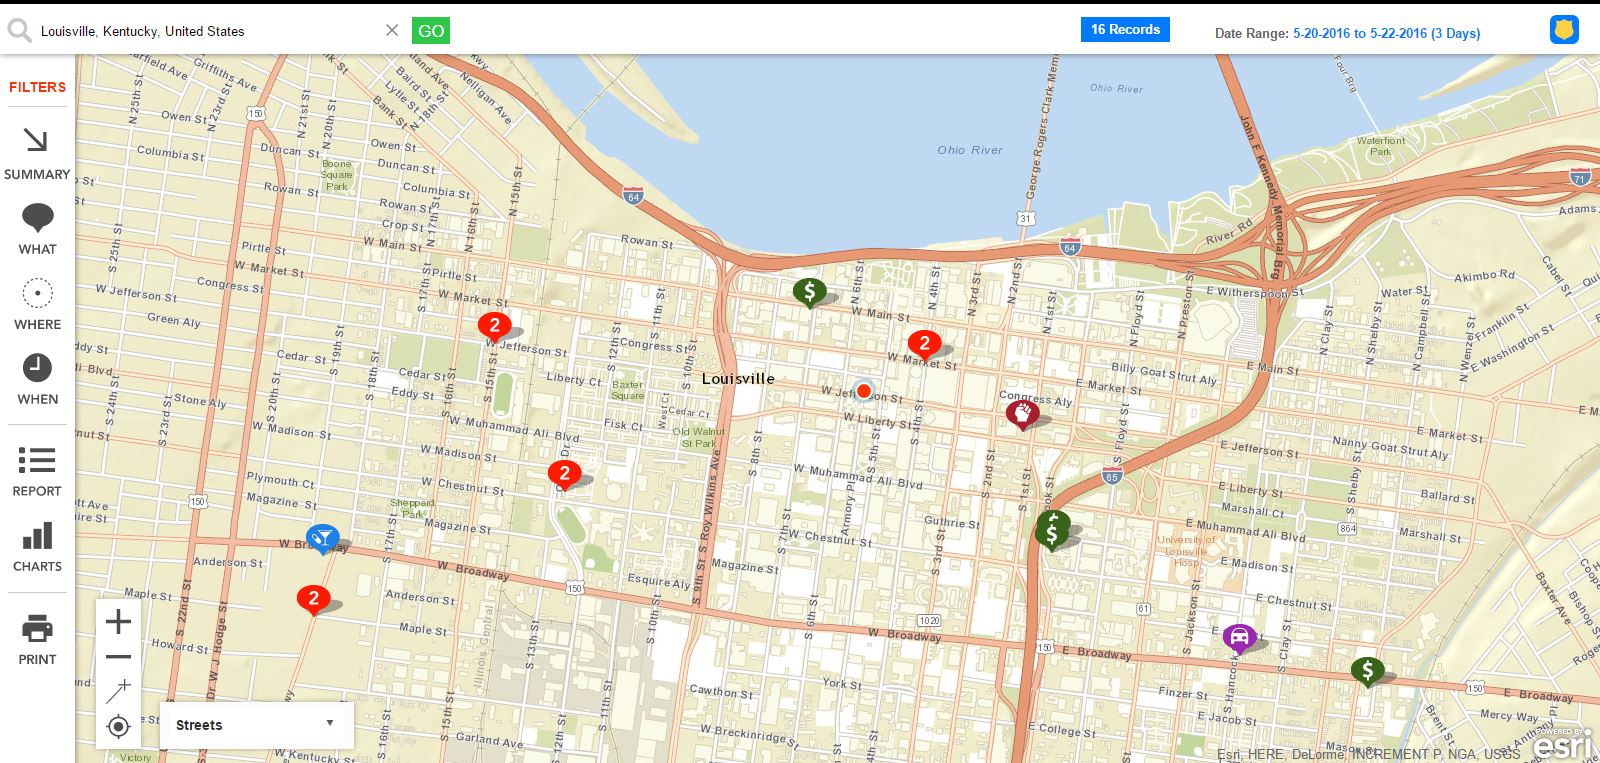
And finally the weekend of the NRA Annual Meeting, 5/20/2016 to 5/22/2016.
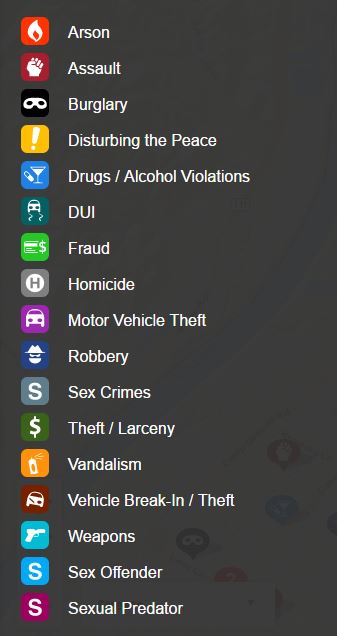
Here is a handy guide of what the icons mean:
The area in display covers way more than what most attendees probably walked around the Annual Meeting. For the NRA AM weekend, we see 5 icons with numbers, three represent multiple dug offenses and the other two are multiple larcenies.
As for the rest, you draw your own conclusions.
If a kind soul reminds me next week, I will update this post with the crime results for the upcoming weekend.
Update: It was told that the area shown does not correspond dead center with where the big exhibition happened and that is right.
I centered by mistake at the Kentucky Int’l Convention Center where the National NRA Foundation Banquet has held rather than the Kentucky Exposition Center.
I did go back to CrimeMapping.com and selected an area that covered both places and to get a better feel, I did the whole week rather than just the weekend. There is still a noticeable reduction in crime even when the area bigger and less affected by the attendees. I will update the maps at a later date since we are heading into a holiday weekend.
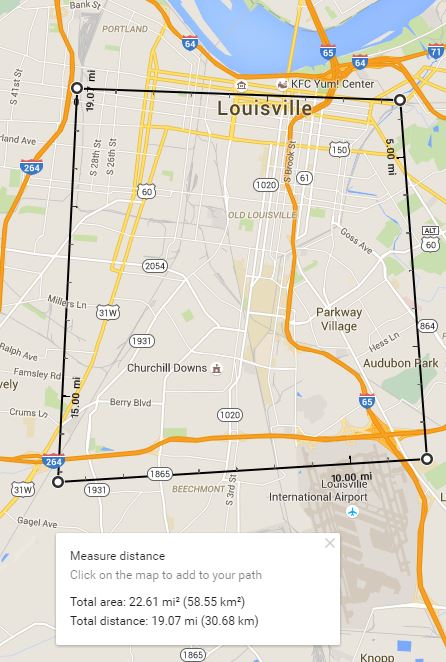
Maybe 22 square miles might be a tad much,,,, 🙂
Like this:
Like Loading...